ODE With Birth and Death Process
We follow on from the SIR model of Simple Problem but with additional birth and death processes.
\[\begin{split}\frac{dS}{dt} &= -\beta SI + B - \mu S\\
\frac{dI}{dt} &= \beta SI - \gamma I - \mu I\\
\frac{dR}{dt} &= \gamma I.\end{split}\]
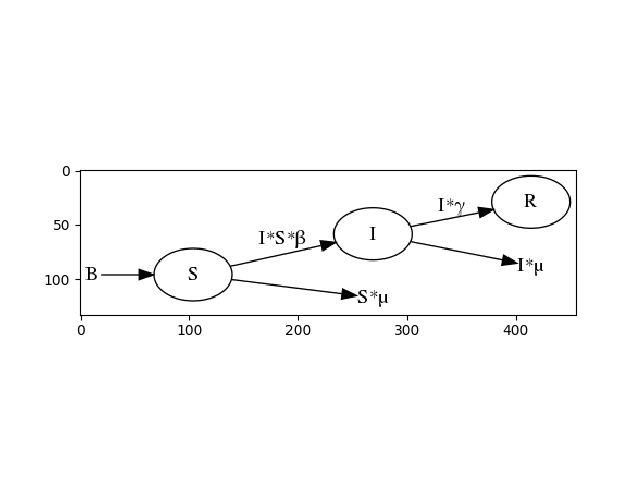
which consists of two transitions and three birth and death process
![digraph SIR_Model {
rankdir=LR;
size="8"
node [shape = circle];
S -> I [ label = "βSI" ];
I -> R [ label = "γI" ];
B [height=0 margin=0 shape=plaintext width=0];
B -> S;
"S**2*μ" [height=0 margin=0 shape=plaintext width=0];
S -> "S**2*μ";
"I*μ" [height=0 margin=0 shape=plaintext width=0];
I -> "I*μ";
}](../_images/graphviz-46f71107bcb68ea35413b7e79984d17d175b16ba.png)
Let’s define this in terms of ODEs, and unroll it back to the individual processes.
In [1]: from pygom import Transition, TransitionType, SimulateOde, common_models

In [2]: import matplotlib.pyplot as plt

In [3]: stateList = ['S', 'I', 'R']

In [4]: paramList = ['beta', 'gamma', 'B', 'mu']

In [5]: odeList = [
   ...:            Transition(origin='S',
   ...:                       equation='-beta*S*I + B - mu*S',
   ...:                       transition_type=TransitionType.ODE),
   ...:            Transition(origin='I',
   ...:                       equation='beta*S*I - gamma*I - mu*I',
   ...:                       transition_type=TransitionType.ODE),
   ...:            Transition(origin='R',
   ...:                       equation='gamma*I',
   ...:                       transition_type=TransitionType.ODE)
   ...:            ]
   ...:

In [6]: ode = SimulateOde(stateList, paramList, ode=odeList)

In [7]: ode2 = ode.get_unrolled_obj()

In [8]: f = plt.figure()

In [9]: ode2.get_transition_graph()
Out[9]: <graphviz.dot.Digraph at 0x7f59c53f9e80>

In [10]: plt.close()